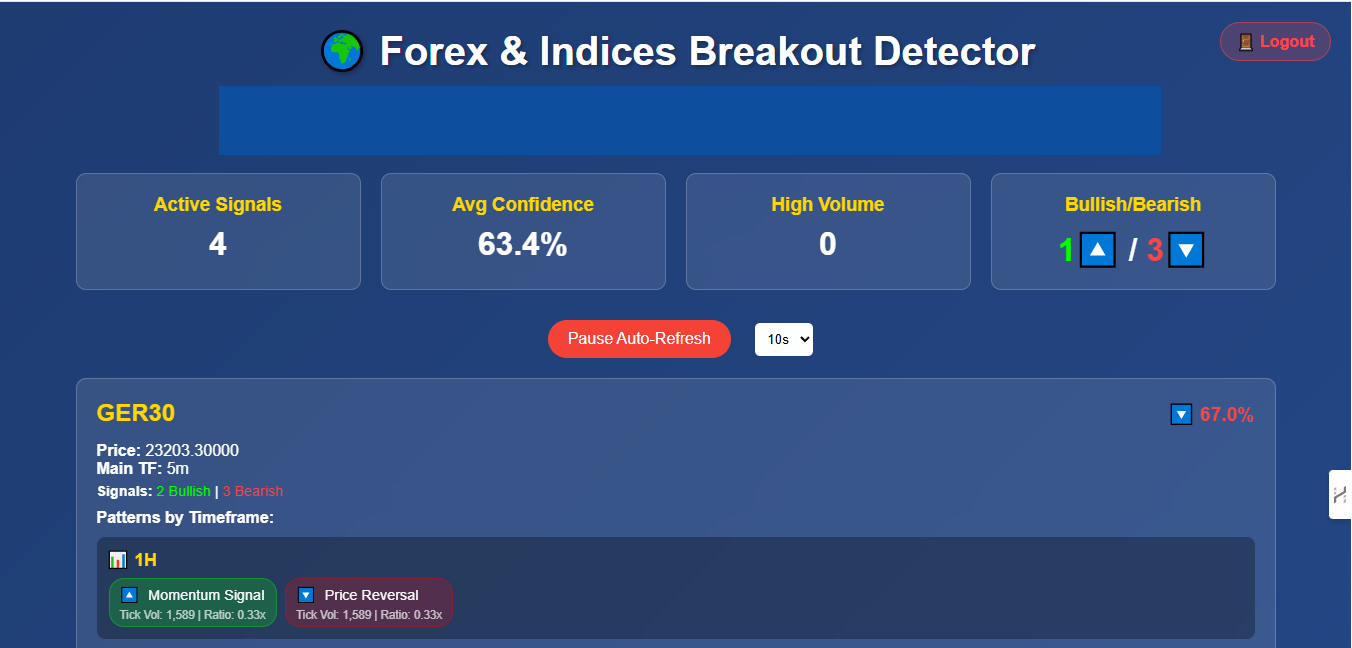
The Break Detector is your automated eye for market structure. It watches the charts 24/7 to spot when price breaks through key levels, which often signals the start of a big move.
The tool continuously analyzes price action across multiple timeframes to identify significant support and resistance levels. When price closes beyond these key levels, it displays the breakout signal on your dashboard with a probability score, confirming that market structure is shifting.
Monitor the dashboard for high-probability breakout signals to identify potential trade entries at the beginning of new trends. The tool removes the subjectivity of manually drawing support and resistance lines by automatically detecting and ranking breakout opportunities based on technical analysis and machine learning.
Numbers on the screenshot correspond to the explanations below
Displays the currency pair or instrument with the highest breakout probability at the current moment. This is your top trading opportunity, prioritized by the algorithm based on technical pattern strength and market conditions.
Displays detected signal types including Price Level Breaks, Volatility Breaks, Momentum Signals, Trend Confirmations, AI Analysis, and Price Reversals. Each pattern type indicates a different market condition or opportunity.
Probability in percentage. Red indicates a sell signal, and Green indicates a buy signal. This score represents the algorithm's confidence in the breakout.
Controls to pause or resume the auto-refresh feature. Located next to the countdown timer (e.g., 30s), allowing you to freeze the data for closer inspection without updates overwriting the view.
Overall probability score calculated across all active signals. This gives you a quick view of market-wide breakout quality. Higher average confidence indicates stronger overall market conditions with more reliable patterns forming.
Total number of bullish (buy) vs bearish (sell) signals currently active based on probability threshold. This helps you gauge overall market sentiment—more bullish signals suggest uptrend dominance, while more bearish signals indicate downtrend conditions.
Breakout of significant support or resistance levels.
Price experiencing significant expansion beyond normal ranges.
Strong directional momentum confirmed by technical analysis.
Trend-following indicators aligning with price direction.
Machine learning model predicting future price direction.
Potential reversal patterns at key levels.
The strongest breakouts are accompanied by increased volume. Look for momentum indicators confirming the move before entering.
Place your stop-loss just below the broken level for longs (or above for shorts). If price reclaims that level, the breakout has failed.
Cross-reference breakouts across multiple timeframes. A 4H breakout confirmed by a Daily level has higher probability than a 5M breakout alone.
Detects breakouts immediately as price data updates, analyzing 12+ pattern types.
Analyzes 1M, 5M, 15M, 30M, and 1H timeframes simultaneously for confluence.
Machine learning model predicts price direction with cross-validated reliability scores.