Strength & Weakness Signals

The Strength & Weakness Signals tool is your market compass. Instead of guessing which currency is strong or weak, this tool analyzes the entire market in real-time to give you a clear score. It compares every major currency against each other to identify the true movers.

Login required to access this tool

Login Sign Up

Understanding the Currency Strength Meter

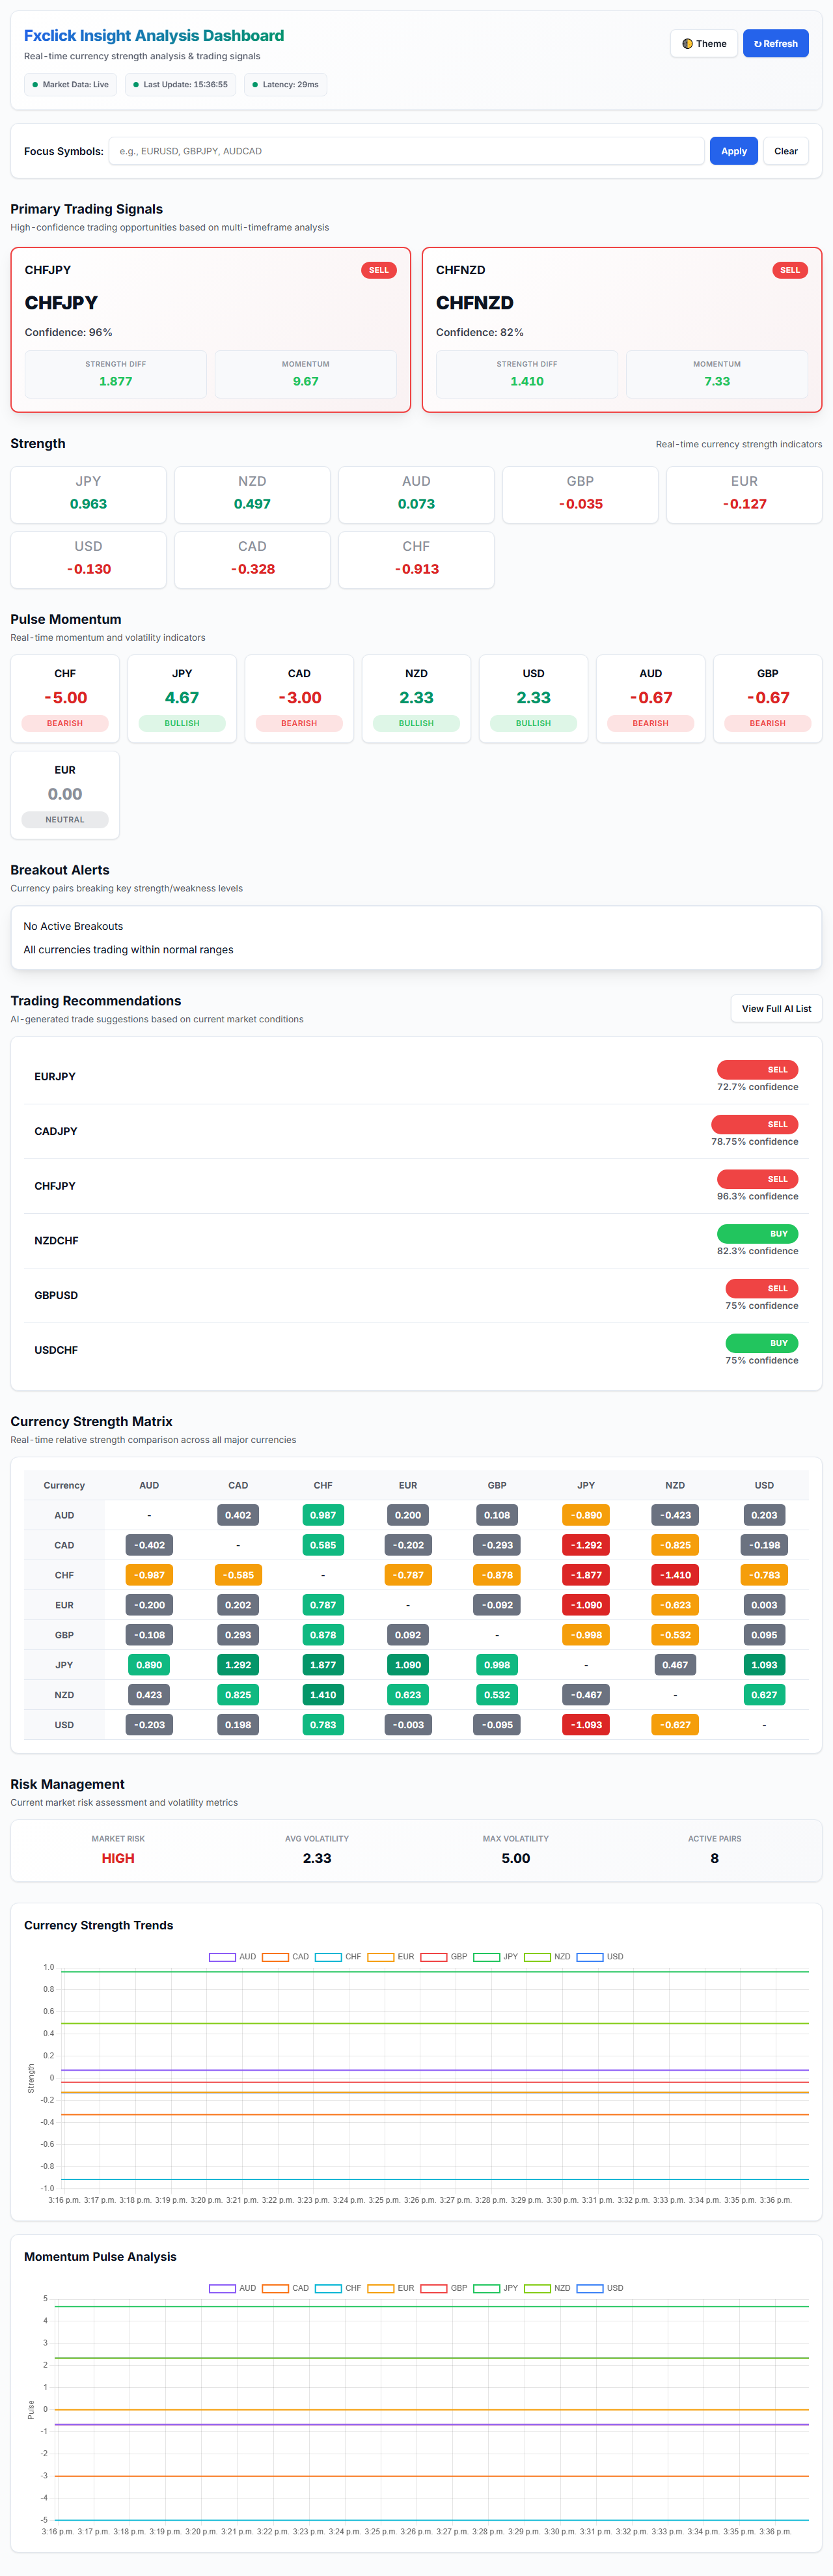
The Currency Strength Meter is a powerful analytical tool that evaluates and ranks the relative strength of major currencies (USD, EUR, GBP, JPY, AUD, NZD, CAD, CHF) in real-time. Unlike traditional chart analysis that focuses on individual pairs, this tool provides a bird's-eye view of the entire forex market.

How It Works

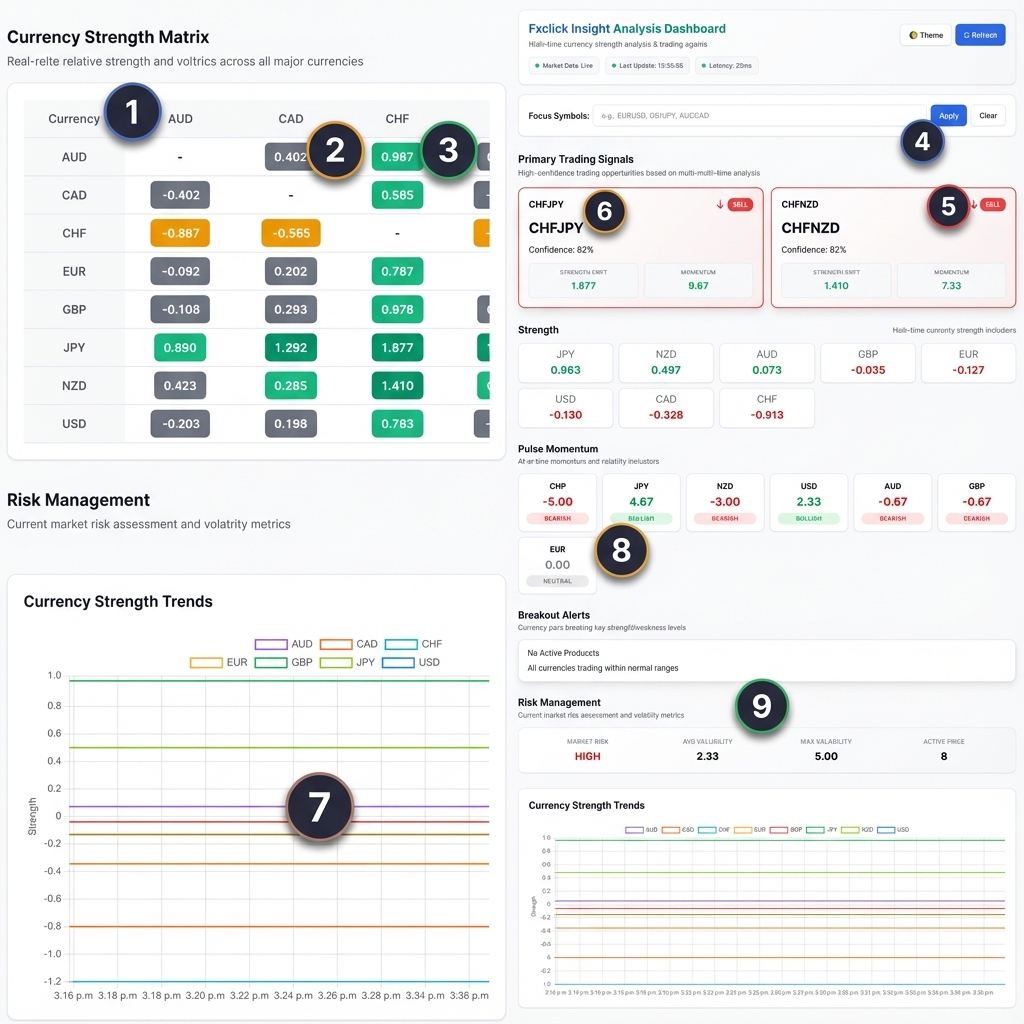
The meter calculates strength scores by analyzing price movements across all major currency pairs. Each currency receives a score based on its performance against all other currencies. A high score indicates strength (appreciating), while a low score indicates weakness (depreciating).

Trading Strategy

The Golden Rule: Trade pairs where there's maximum divergence between strength and weakness.

  • Strong Buy Signal: Pair the strongest currency with the weakest (e.g., if USD is strongest and JPY is weakest, consider buying USD/JPY)
  • Avoid Choppy Markets: Don't trade pairs where both currencies have similar strength scores
  • Confirm Trends: Use the strength meter alongside your technical analysis for higher probability setups
  • Monitor Changes: Watch for strength divergences that persist over multiple timeframes for the most reliable signals
Currency Strength Meter Screenshot
Understanding the Interface
A detailed breakdown of what you see in the Currency Strength Meter
Currency Strength Meter Interface with numbered annotations

Numbers on the screenshot correspond to the explanations below

1

Strength Matrix

The main table displays all 8 major currencies (USD, EUR, GBP, JPY, AUD, NZD, CAD, CHF) with their current strength scores. Each row represents one currency's performance against all others.

2

Strength Scores

Numerical values show each currency's calculated strength, typically ranging from -10 to +10. Positive values indicate strength (currency is appreciating), while negative values indicate weakness (currency is depreciating).

3

Color Indicators

Cells are color-coded for quick visual analysis: Green indicates strong currencies, Red indicates weak currencies, and Gray/Neutral shows currencies with minimal movement.

4

Pair Search

Search field allows you to quickly find and focus on specific currency pairs (e.g., EUR/USD, GBP/JPY). Type the pair you're interested in to filter the display and analyze only the currencies you're actively trading.

5

Trend Direction

Arrow indicators show whether each currency's strength is increasing (↑), decreasing (↓), or stable (→). This helps identify currencies gaining or losing momentum in real-time.

6

Pair Suggestions

Interface highlights suggested pairs based on maximum divergence (strongest vs weakest currency). These represent the highest probability trading opportunities at that moment.

7

Strength Indicator

Visual strength bars or gauges show relative currency strength at a glance. Longer/fuller bars indicate stronger currencies, while shorter bars show weaker ones. This provides instant visual confirmation of the numerical scores.

8

Pulse Momentum

Momentum indicator shows the rate of change in currency strength. High momentum values indicate rapidly shifting strength, while low values suggest stability. Use this to identify explosive moves or consolidation periods.

9

Market Volatility

Displays key volatility metrics including Avg Volatility, Max Volatility, and Active Pairs. The Market Risk indicator (Low/High) provides an instant assessment of current market conditions, helping you gauge overall stability.

Quick Reading Guide

Maximize the Gap

Trade pairs with the largest difference in Strength Scores. A wide gap between the base and quote currency indicates a high-probability trend.

Confirm with Pulse

Ensure the Pulse Momentum aligns with the Strength Score. When both indicators point in the same direction, the move is often explosive and sustained.

Verify Consistency

True trends show consistent strength across neighboring timeframes. Look for currencies that are green (strong) or red (weak) across M15, H1, and H4 simultaneously.

Key Features

Real-Time Matrix

Instant visualization of currency strength across all major pairs.

Trend Analysis

Track strength changes over time to identify emerging trends.

Pulse Momentum

Monitors rate of change in currency strength to identify explosive moves.

Contact Us

Get in touch with us through any of these channels:

Email
support@fxclickinsight.com
Discord
Join our community
TikTok
@fxclickinsight

Want live support? Sign up for an account!

Sign Up Login